← All 20 Halloween UI animations

Candy Haul Chart: a Halloween micro-interaction

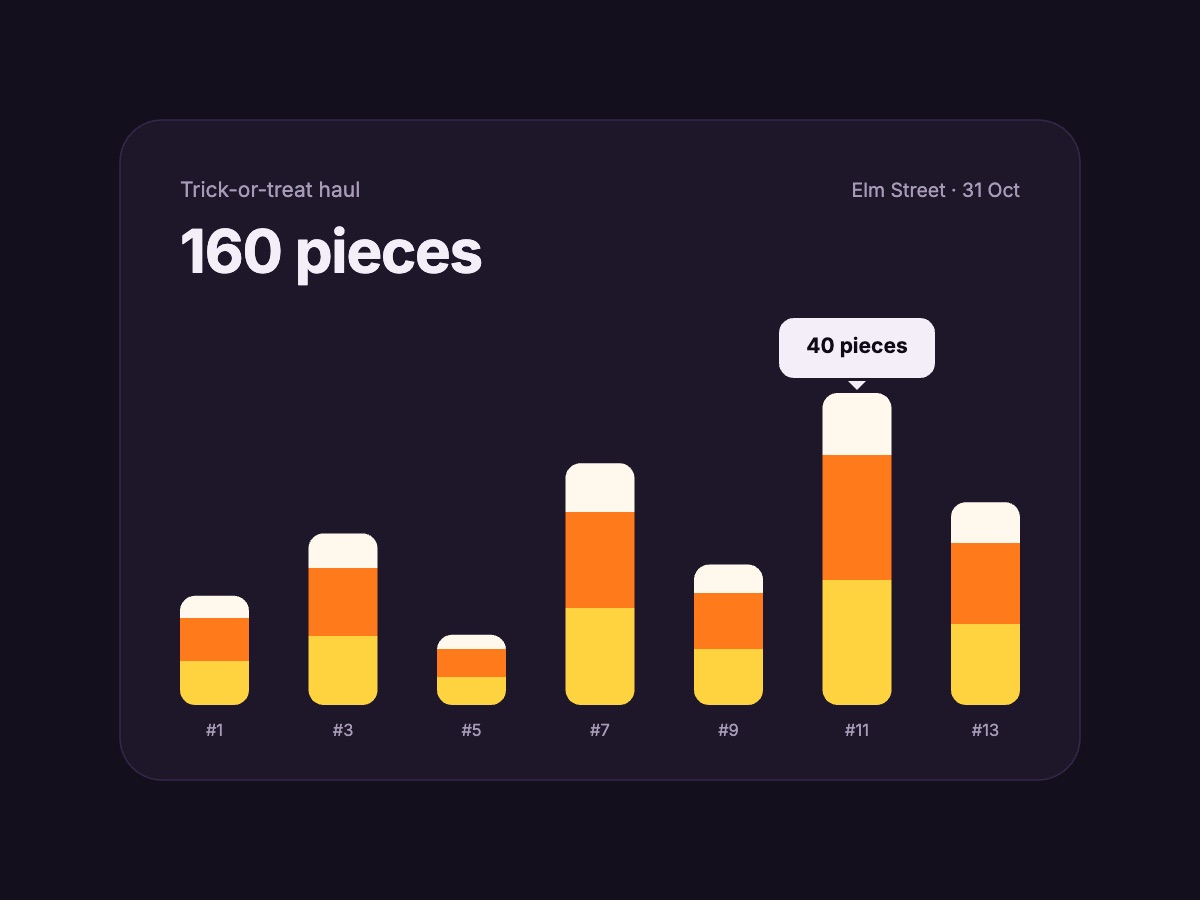
Candy-corn bars grow in and a tooltip follows your pointer. A free, live data for spooky season.

Updated November 2026

Add the Candy Haul Chart to React or Next.js

  1. Pick an animation above. Open it in ExodeUI to change its text and colours, or keep it as it is.
  2. Download the .bexode file and put it in your public folder.
  3. Install the runtime with npm i exodeui.
  4. Render it with ExodeUICanvas. Taps and hovers work out of the box.
import { ExodeUICanvas } from 'exodeui';

export function CandyHaulChart() {
  return (
    <ExodeUICanvas
      src="/ui-gallery/files/candy-chart.bexode"
      autoPlay
      style={{ width: 400, height: 300 }}
    />
  );
}

Frequently asked questions

Is the Candy Haul Chart free to use?
Yes. Try it here, open it in ExodeUI on the free plan or download the .exode file, and ship it with any ExodeUI runtime.
What does the Candy Haul Chart do?
Candy-corn bars grow in and a tooltip follows your pointer. Hover a house to see it.
Can I restyle the Candy Haul Chart for my brand?
Open it in ExodeUI and every colour, label, shape and timing is editable, with its states and triggers already wired in the Logic tab.
Does it work outside React?
The same file plays in the Vue, Svelte, Angular, React Native, SwiftUI and Flutter runtimes.