1
Sankey Flow Diagram React chart
Relational & Network
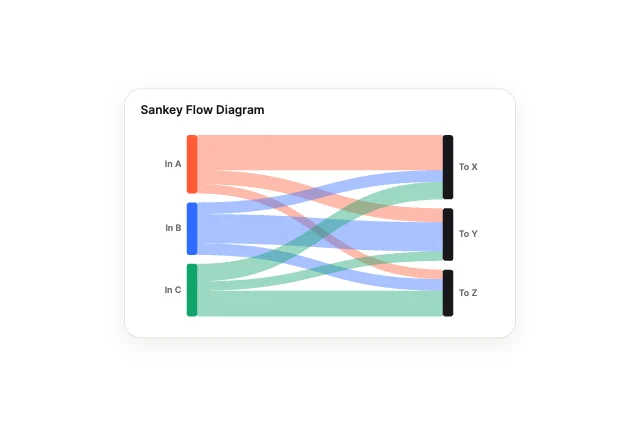
Flow paths whose width follows volume between branching nodes. Our first pick: a relational & network chart with 12 inputs your React code can drive, in a 835-byte file.
React · Charts · Updated November 2026
Need a React chart component with real motion? These five animated charts play in React from one .exode file, chosen from the 100 in Exode Galleries. Each one is live below: try it, then open it in ExodeUI and drop it into your React app with the code at the end.
Relational & Network
Flow paths whose width follows volume between branching nodes. Our first pick: a relational & network chart with 12 inputs your React code can drive, in a 835-byte file.
3D, Perspective & Isometric
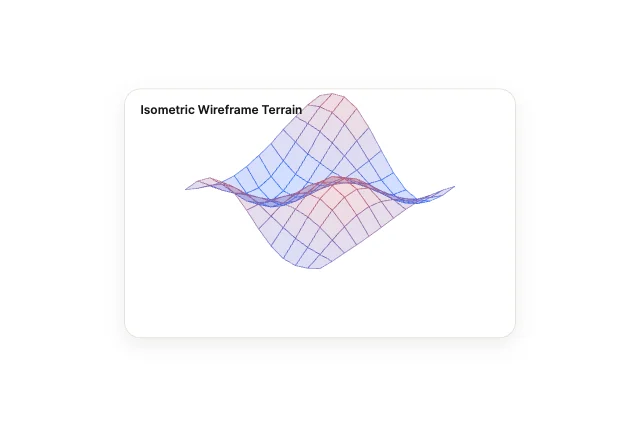
A 30° isometric mesh of peaks and valleys. It is a 3d, perspective & isometric chart with 8 inputs your React code can drive, in a 1.1 KB file.
Interactive & Gestural
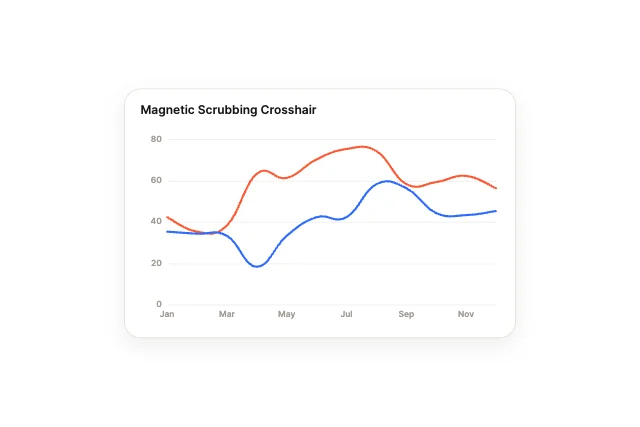
Crosshairs follow the pointer and lock onto the nearest node. It is a interactive & gestural chart with 11 inputs your React code can drive, in a 881-byte file.
Curves, Lines & Areas
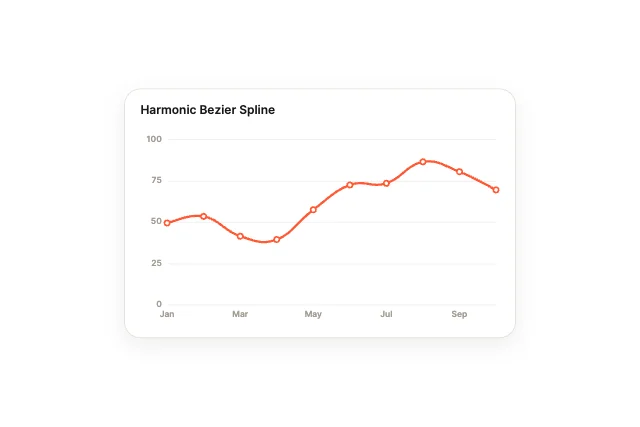
Smooth cubic bezier line through every node, with tension control. It is a curves, lines & areas chart with 10 inputs your React code can drive, in a 816-byte file.
Radial & Circular
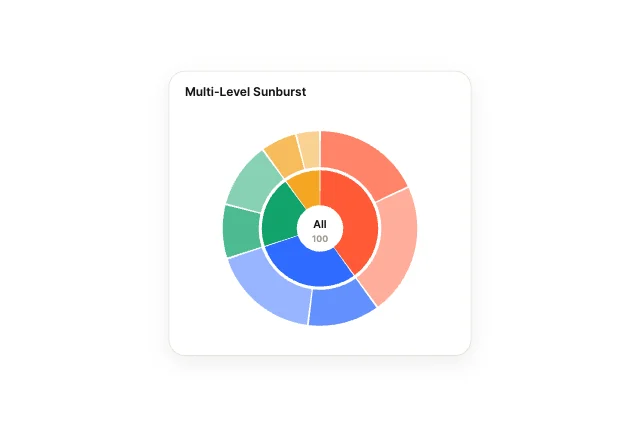
Nested rings breaking down from the inner circle to the outer rings. It is a radial & circular chart with 9 inputs your React code can drive, in a 759-byte file.
Use it as a checklist when you compare the picks above. Each one is a native chart in ExodeUI, so whatever is missing you change in the editor instead of rewriting React code.
| # | Design | Category | Inputs | File |
|---|---|---|---|---|
| 1 | Sankey Flow Diagram | Relational & Network | 12 | 835 B |
| 2 | Isometric Wireframe Terrain | 3D, Perspective & Isometric | 8 | 1.1 KB |
| 3 | Magnetic Scrubbing Crosshair | Interactive & Gestural | 11 | 881 B |
| 4 | Harmonic Bezier Spline | Curves, Lines & Areas | 10 | 816 B |
| 5 | Multi-Level Sunburst | Radial & Circular | 9 | 759 B |
The code for #1, Sankey Flow Diagram, with its real file and input names. Every pick works the same way.
npm install exodeuiimport { useEffect } from 'react';
import { ExodeUICanvas, useExodeUI } from 'exodeui';
export function Sankey() {
const { engine, setEngine, updateInput, fireTrigger } = useExodeUI();
useEffect(() => {
updateInput("Sankey Flow Diagram · Selected item", -1);
}, [engine]);
return (
<>
<ExodeUICanvas src="/sankey.bexode" onReady={setEngine} />
<button onClick={() => fireTrigger("Sankey Flow Diagram · Replay")}>Replay</button>
</>
);
}Pick a design here, open it in ExodeUI and change it, then export a .bexode file. Install exodeui (npm install exodeui) and load the file with the runtime; the code below uses the first pick’s real file and input names. The motion, states and springs live in the file, so your React code only sets and reads inputs.
It depends on the job: Sankey Flow Diagram (relational & network), Isometric Wireframe Terrain (3d, perspective & isometric), Magnetic Scrubbing Crosshair (interactive & gestural) cover different styles. These five are our picks from the 100 charts in Exode Galleries, chosen for range, for how much is wired to inputs and for how well they read small. They are not a survey of other libraries.
They replace it where you want custom motion. Keep the built-in one where the platform default is right, and use an ExodeUI file where the chart is part of your brand.
Yes. They come from Chart Studio, built into the ExodeUI editor and included in the free Community plan. The React runtime is free too.
Yes. Open one in ExodeUI and every part is a native layer: colours, type, motion and logic. The input names stay the same, so your code keeps working.
Free to start. Every studio behind this library is built into the editor, and everything it makes stays native and editable.
Try ExodeUI for free