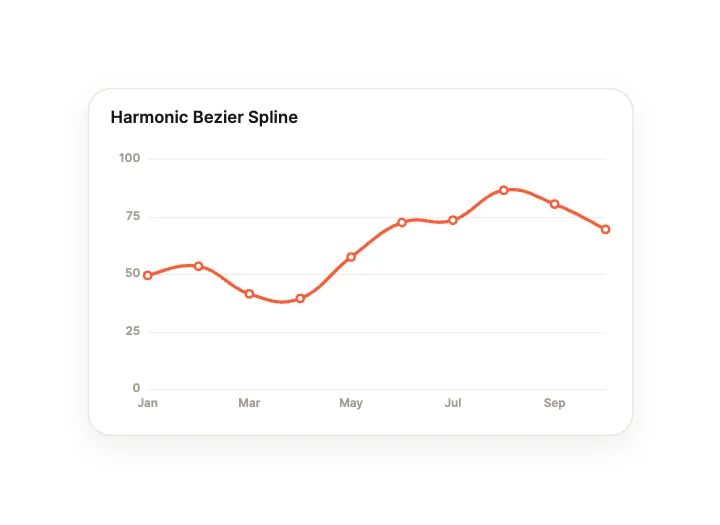
Harmonic Bezier SplineCurves, Lines & Areas
Chart Studio · 100 designs
Animated charts. Splines, rings, Sankey, heatmaps, isometric terrain and gesture charts.
Every chart runs on a native Bar, Pie or Line widget with motion. Data is an input your app sets, and the hovered and selected point come back as inputs too.
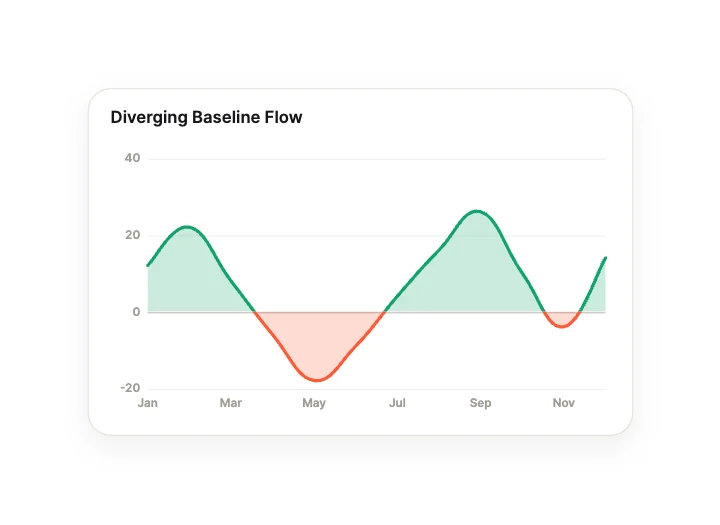
Diverging Baseline FlowCurves, Lines & Areas
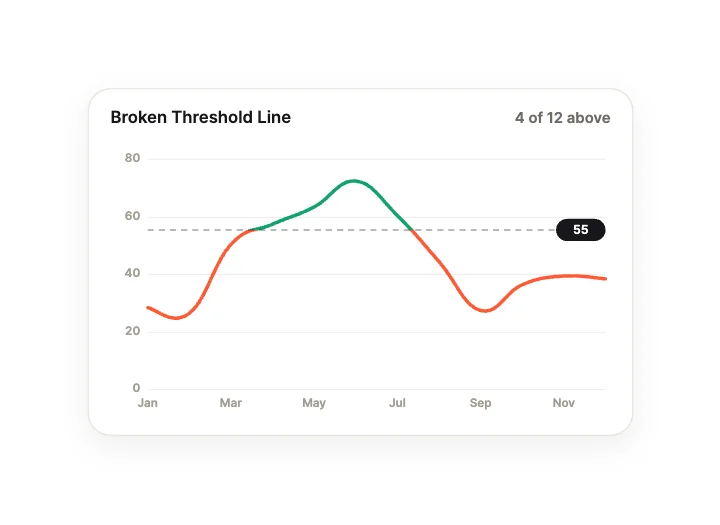
Broken Threshold LineCurves, Lines & Areas
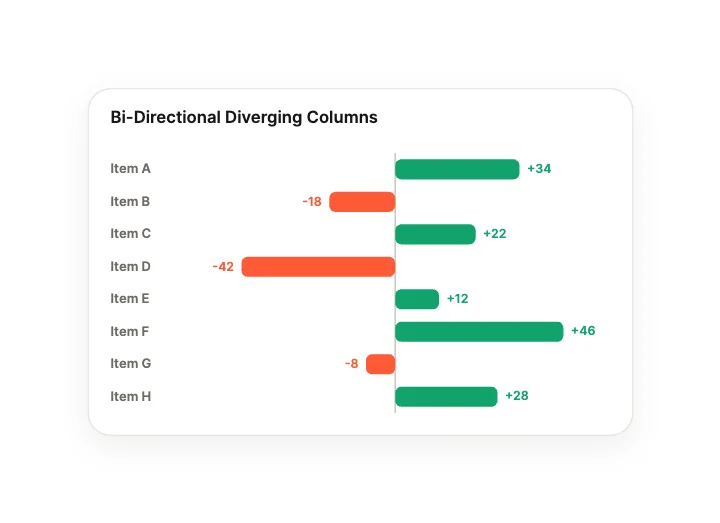
Bi-Directional Diverging ColumnsColumns, Bars & Stacks
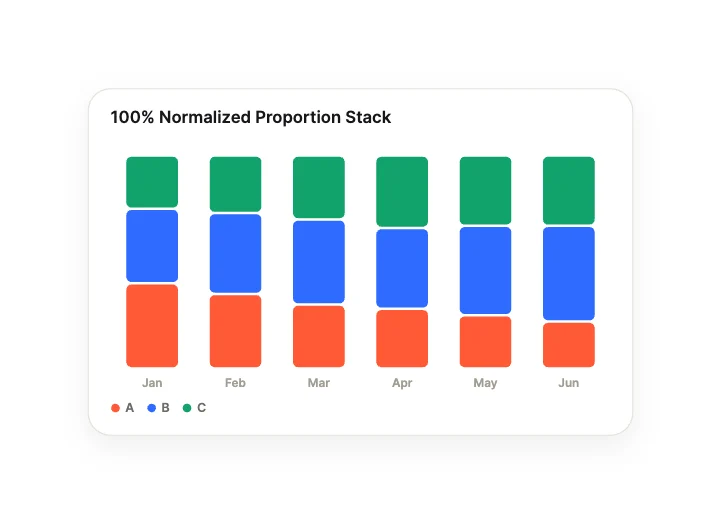
100% Normalized Proportion StackColumns, Bars & Stacks
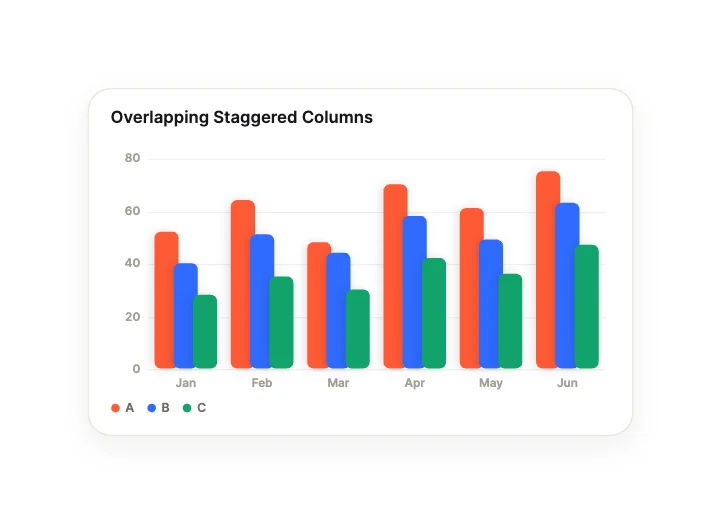
Overlapping Staggered ColumnsColumns, Bars & Stacks
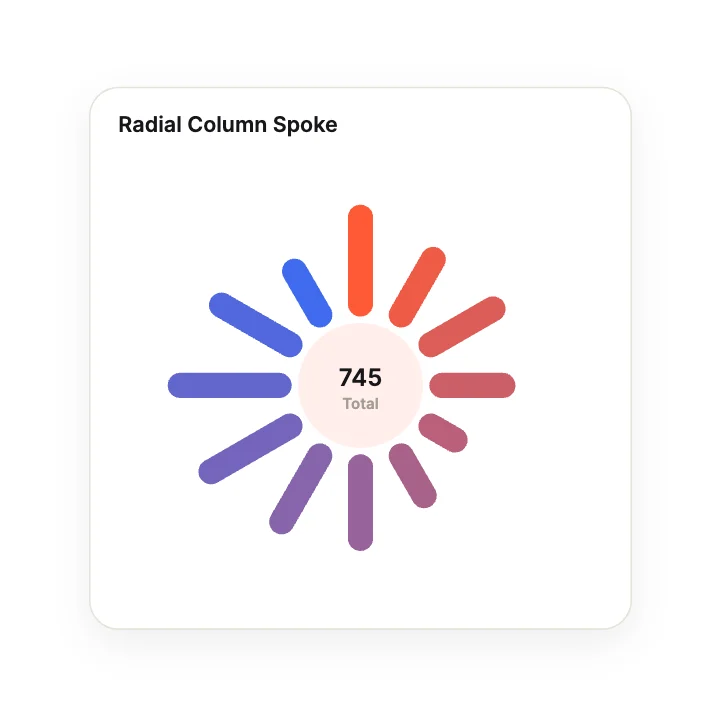
Radial Column SpokeColumns, Bars & Stacks
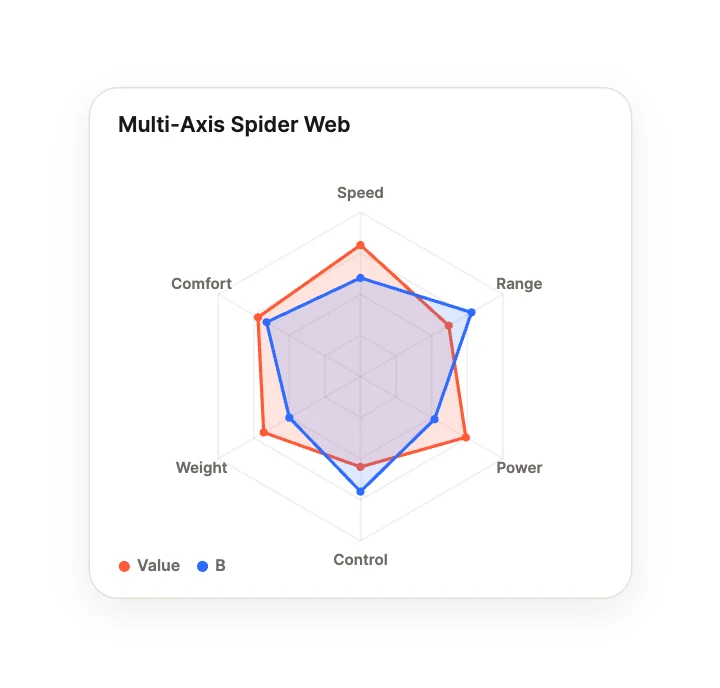
Multi-Axis Spider WebRadial & Circular
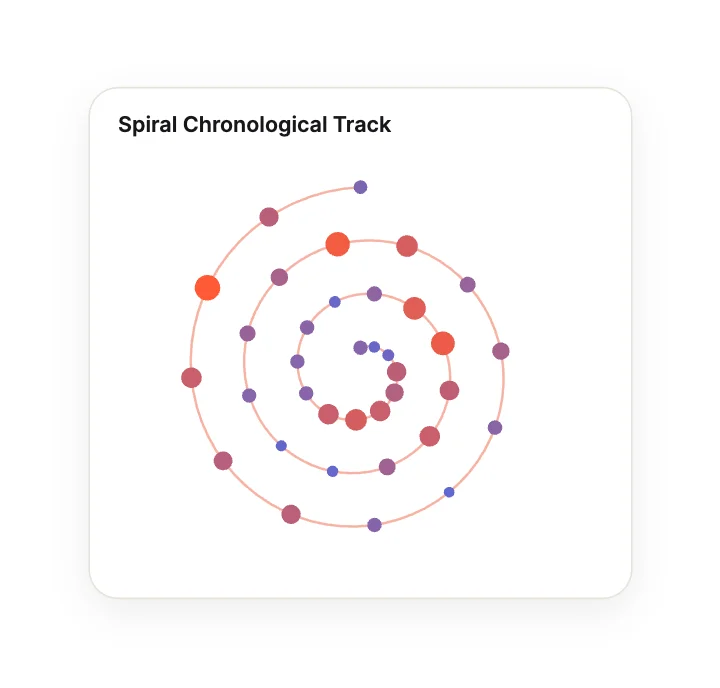
Spiral Chronological TrackRadial & Circular
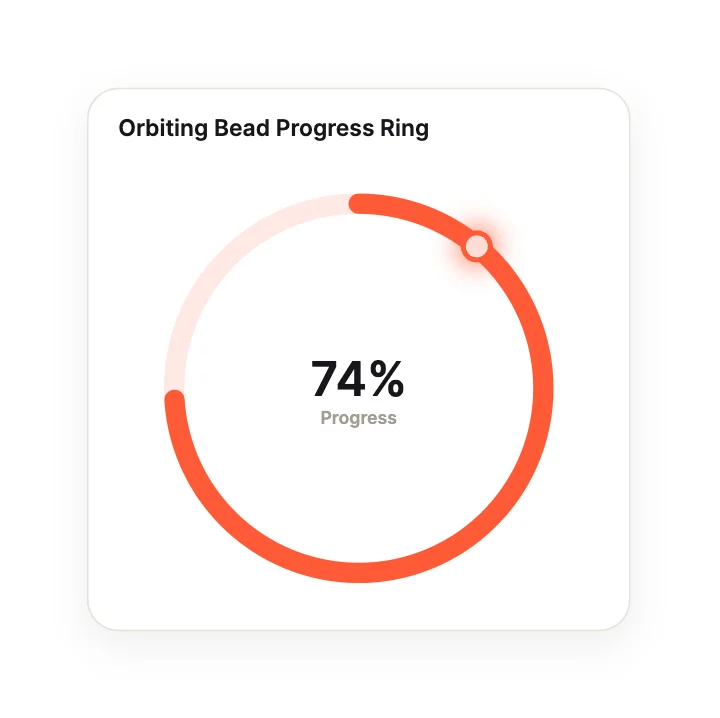
Orbiting Bead Progress RingRadial & Circular
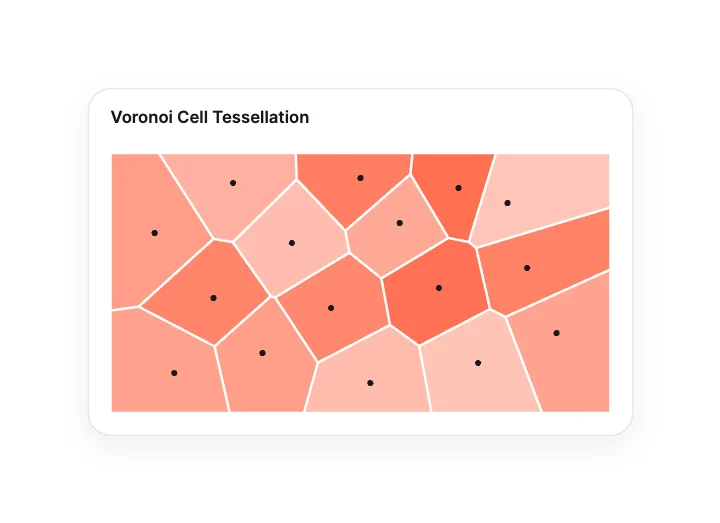
Voronoi Cell TessellationGrids, Matrices & Density
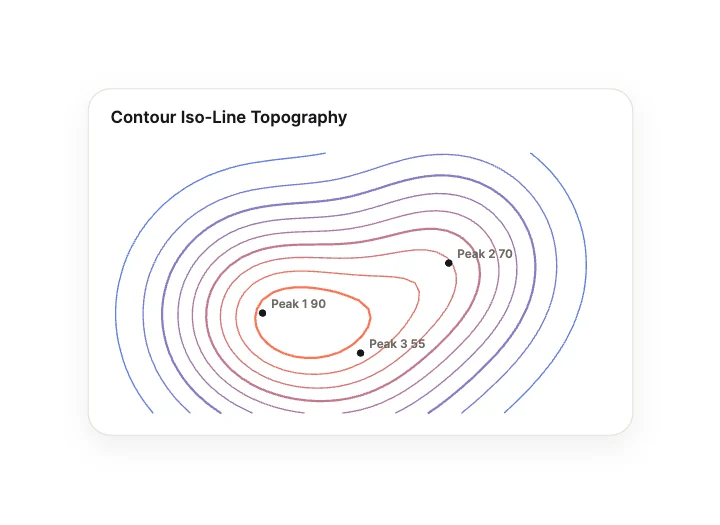
Contour Iso-Line TopographyGrids, Matrices & Density
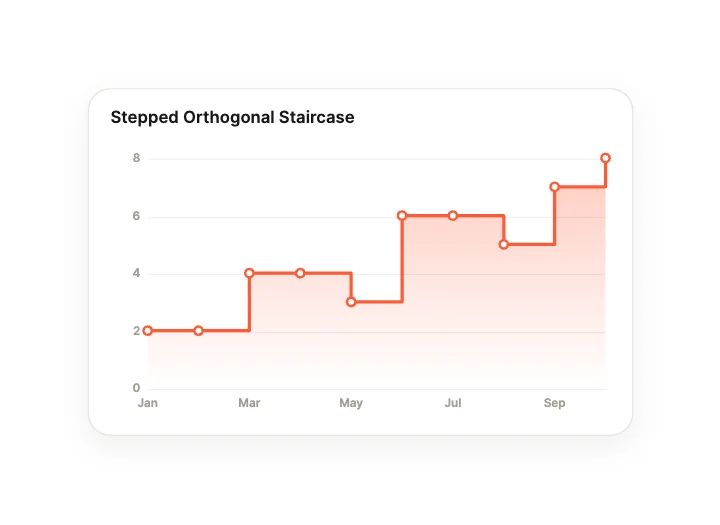
Stepped Orthogonal StaircaseCurves, Lines & Areas
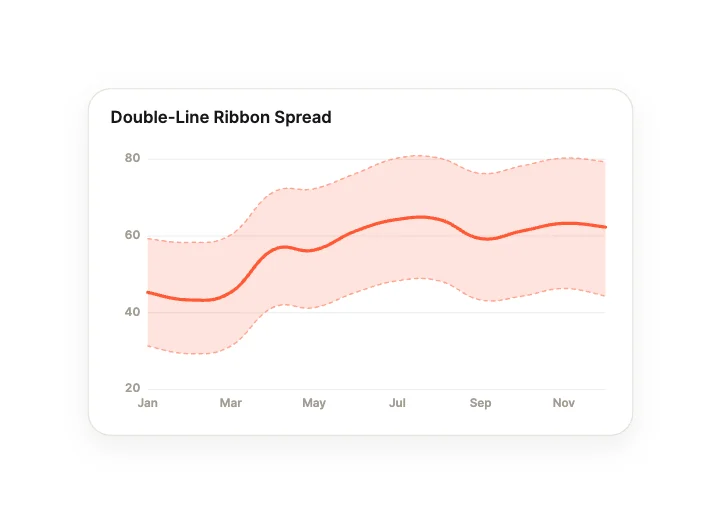
Double-Line Ribbon SpreadCurves, Lines & Areas
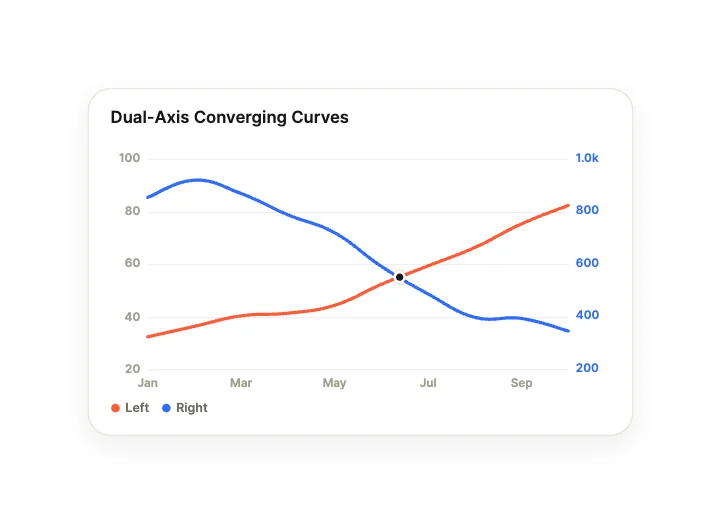
Dual-Axis Converging CurvesCurves, Lines & Areas
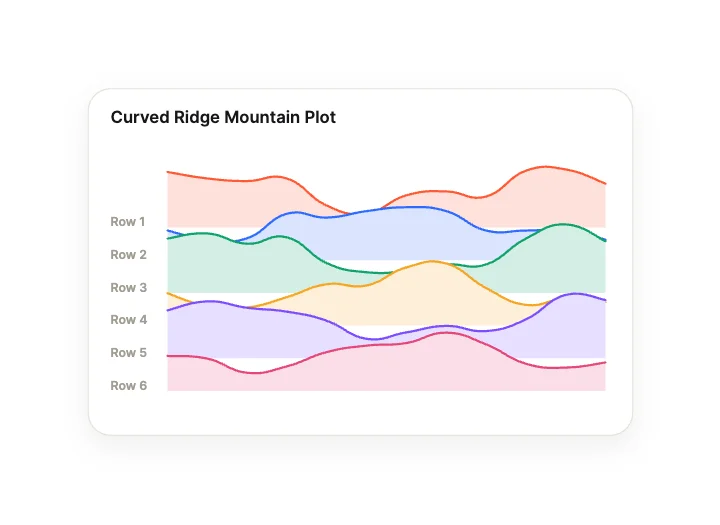
Curved Ridge Mountain PlotCurves, Lines & Areas
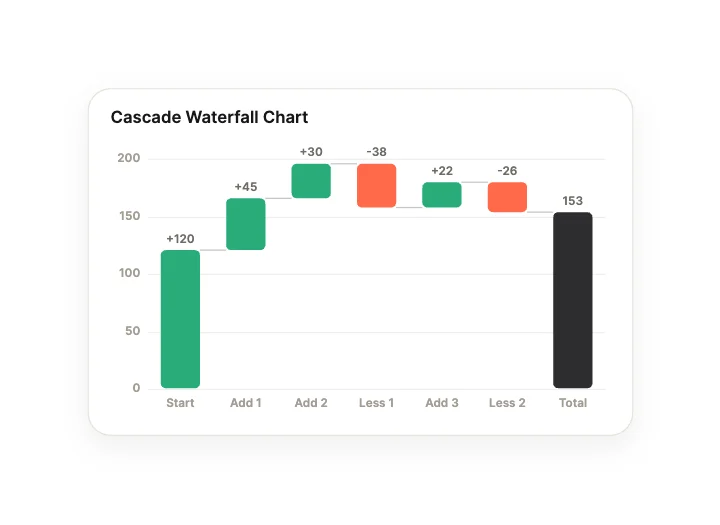
Cascade Waterfall ChartColumns, Bars & Stacks
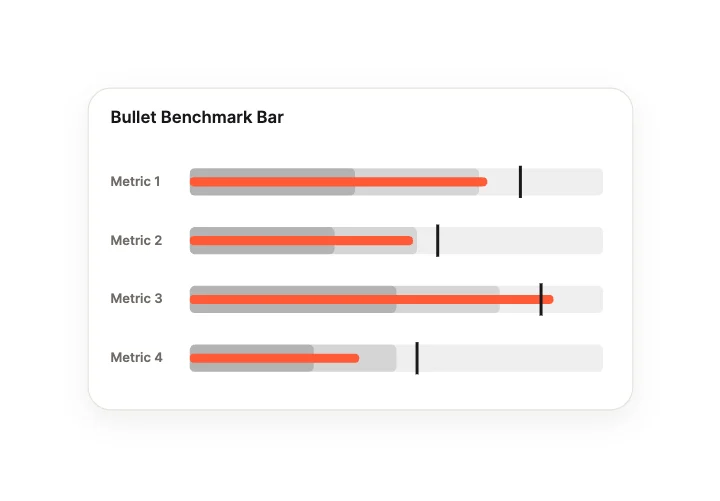
Bullet Benchmark BarColumns, Bars & Stacks
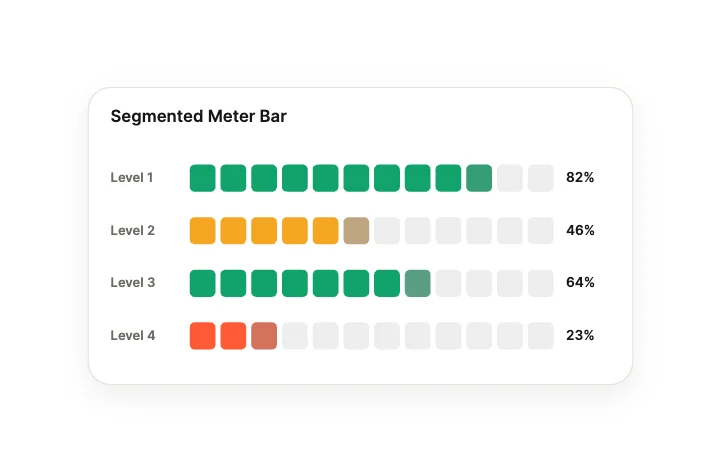
Segmented Meter BarColumns, Bars & Stacks
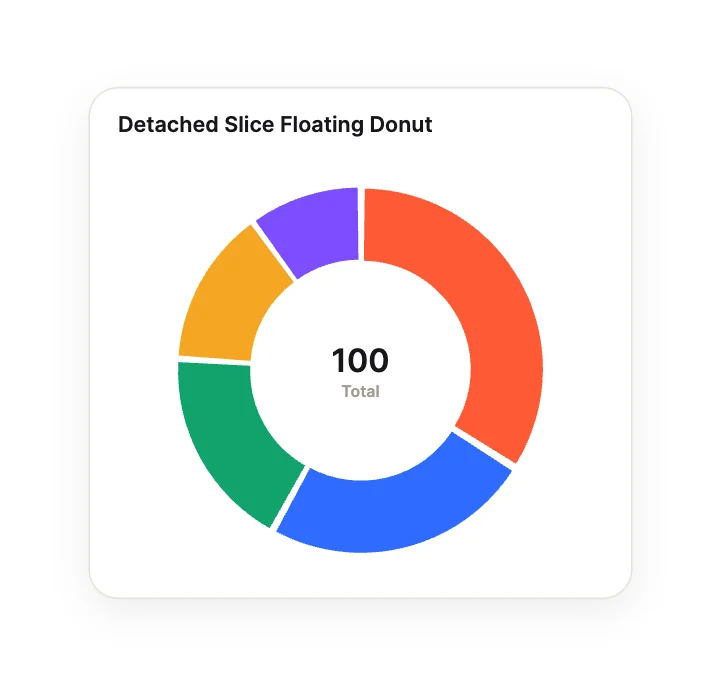
Detached Slice Floating DonutRadial & Circular
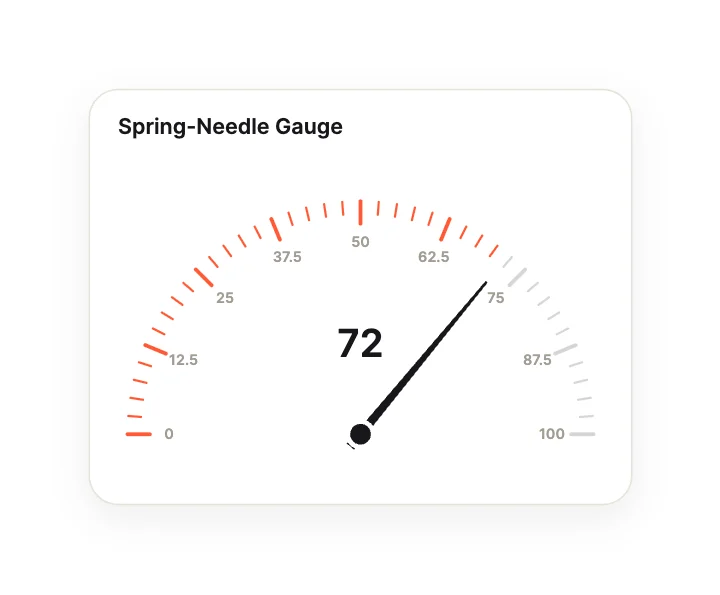
Spring-Needle GaugeRadial & Circular
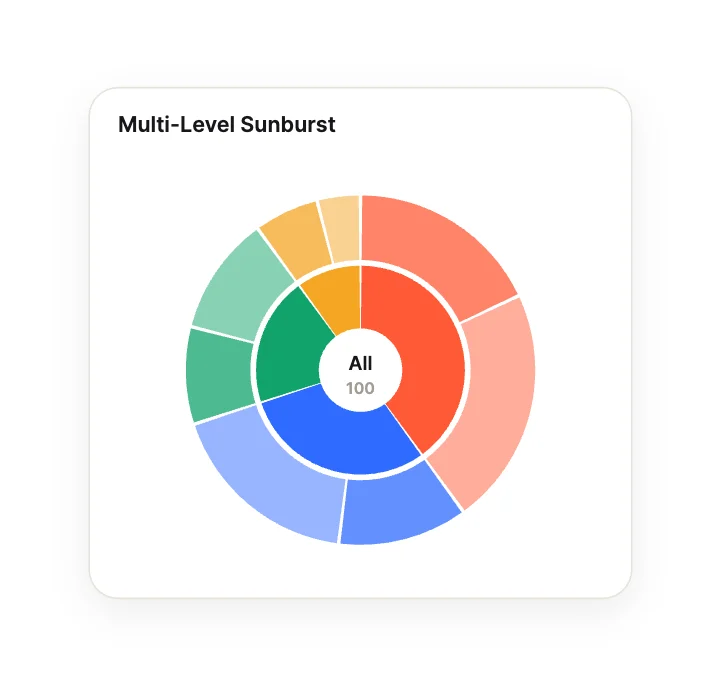
Multi-Level SunburstRadial & Circular
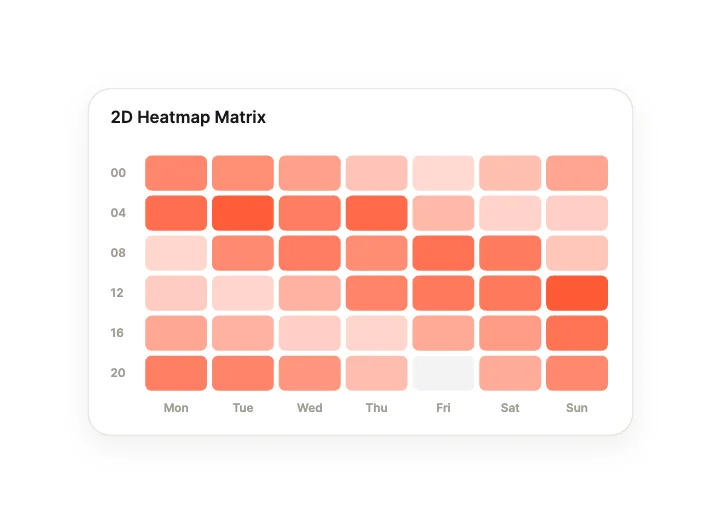
2D Heatmap MatrixGrids, Matrices & Density
Nested Treemap RectanglesGrids, Matrices & Density
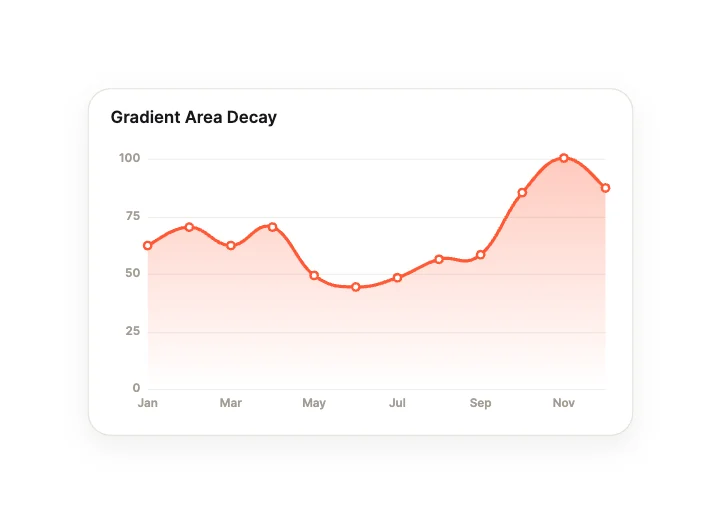
Gradient Area DecayCurves, Lines & Areas
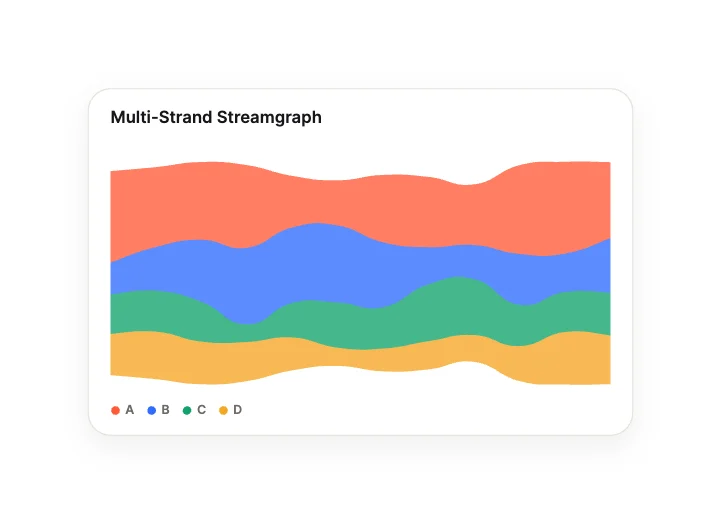
Multi-Strand StreamgraphCurves, Lines & Areas
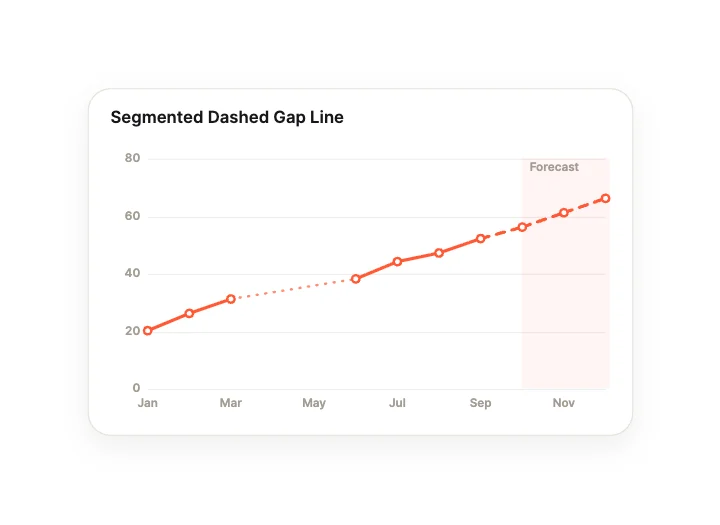
Segmented Dashed Gap LineCurves, Lines & Areas
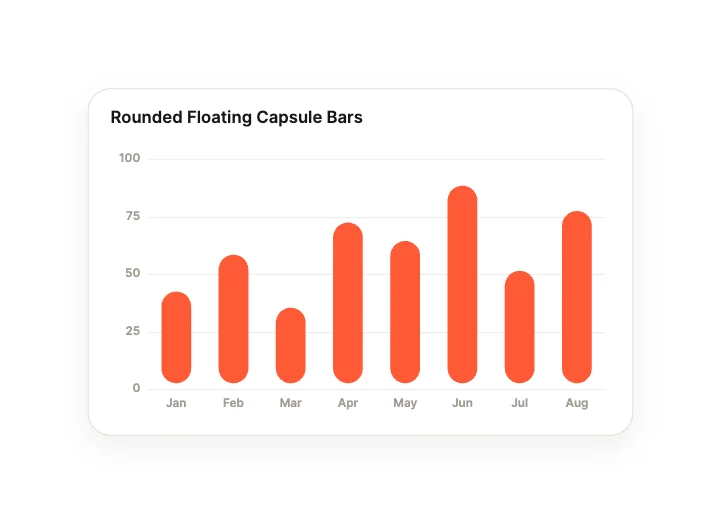
Rounded Floating Capsule BarsColumns, Bars & Stacks
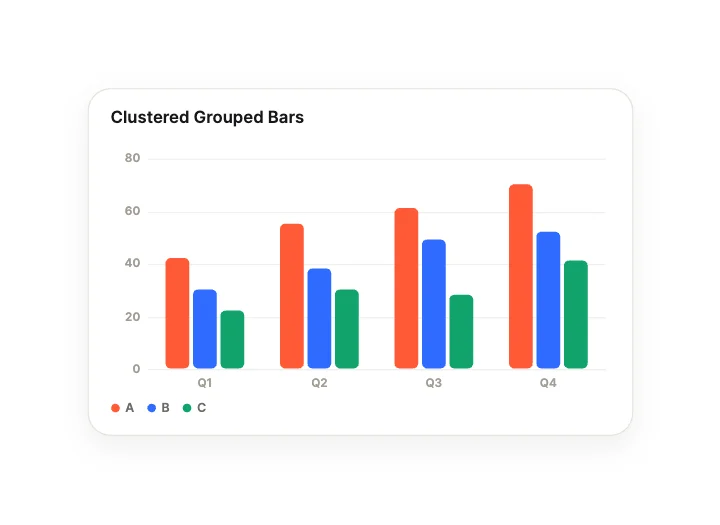
Clustered Grouped BarsColumns, Bars & Stacks
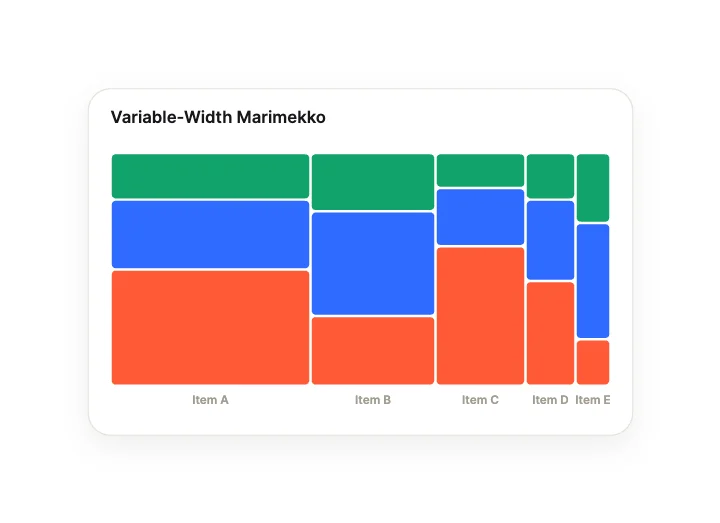
Variable-Width MarimekkoColumns, Bars & Stacks
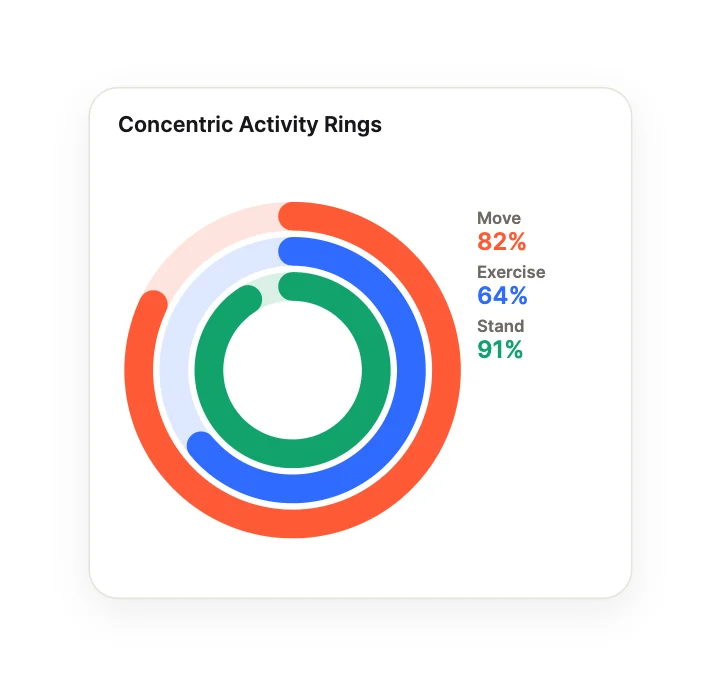
Concentric Activity RingsRadial & Circular
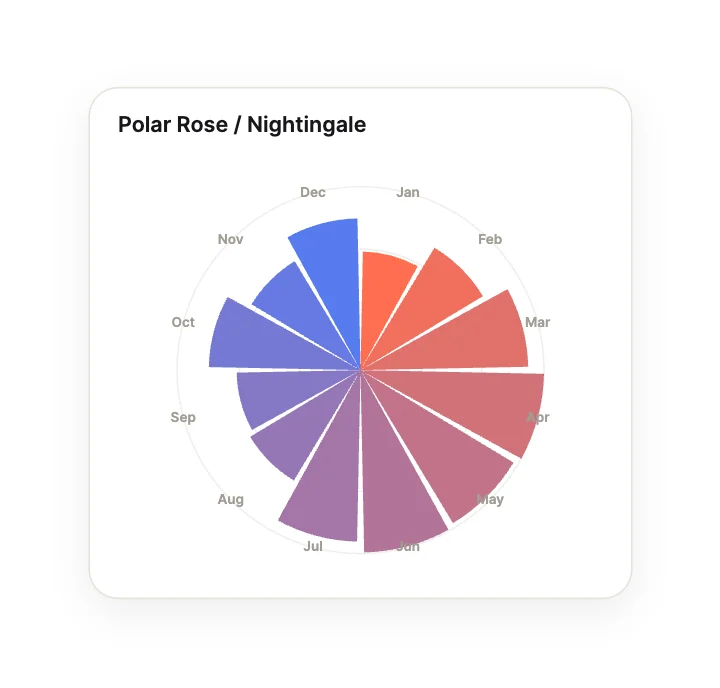
Polar Rose / NightingaleRadial & Circular
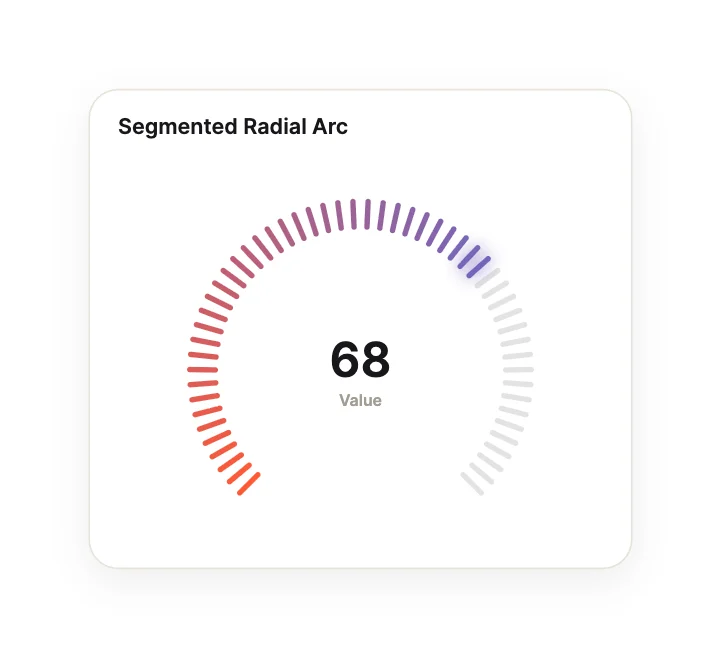
Segmented Radial ArcRadial & Circular
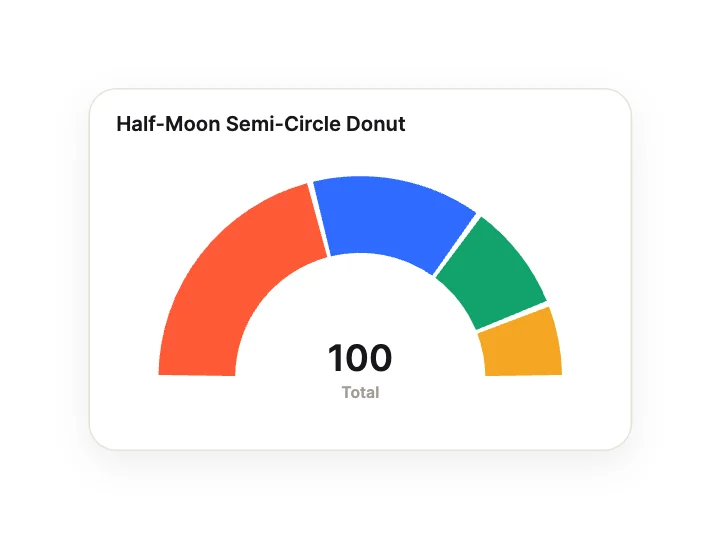
Half-Moon Semi-Circle DonutRadial & Circular
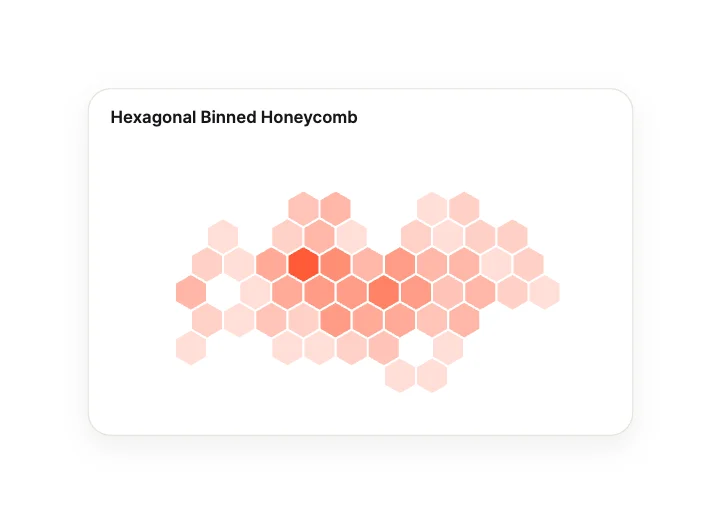
Hexagonal Binned HoneycombGrids, Matrices & Density
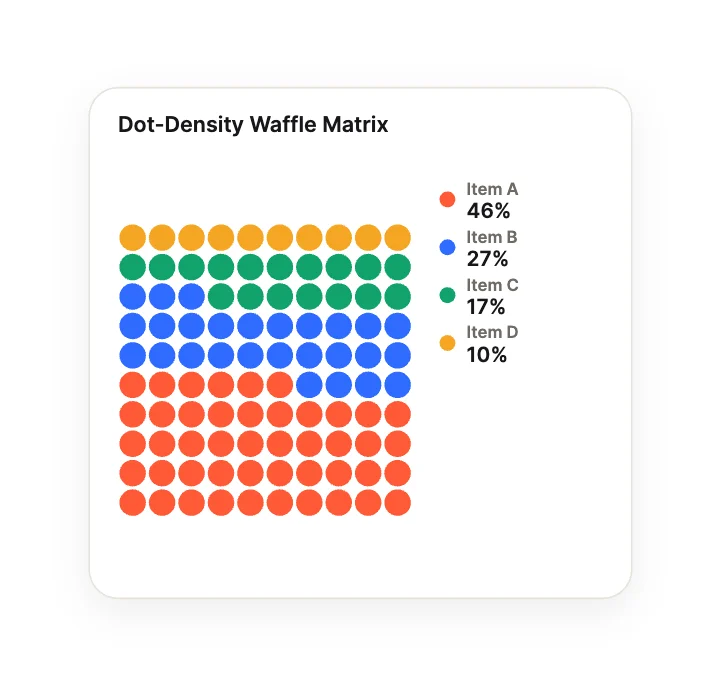
Dot-Density Waffle MatrixGrids, Matrices & Density
Loading more… 36 of 100
How to use them
- Open Chart Studio
It is in the Plugins menu of the editor.
- Pick a chart
Browse 10 categories, from Curves, Lines & Areas to Kinetic & Simulated.
- Set theme and accent
Then insert.
- Send your data
Set the data inputs from your app, or bind them to live data.
Best charts, by runtime
Questions
How do I use these charts in my app?
Open one in ExodeUI, export the file and play it with the ExodeUI runtime for your stack. Hover or tap the data. Your app sets the data and reads the selection.
Are these charts free?
Yes. Chart Studio is built into the ExodeUI editor and included in the free Community plan.
Can I change the design?
Yes. Every part is a native layer in the editor: colours, type, motion and logic, and the input names your code uses stay the same.
More kinds
Make your own in ExodeUI
Free to start. Every studio behind this library is built into the editor, and everything it makes stays native and editable.
Try ExodeUI for free