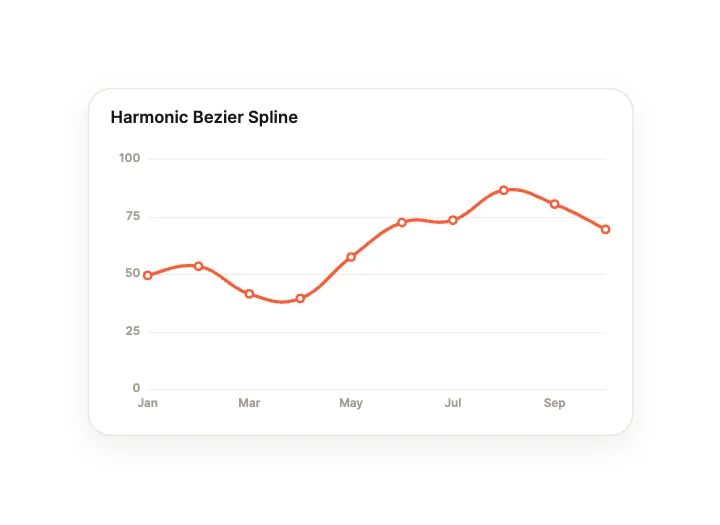
Harmonic Bezier SplineCurves, Lines & Areas
Free · Live demos · Updated November 2026
Free animated line chart
These 10 free animated line charts include smooth splines, area charts, step lines and a line with a dashed forecast. Each one is live below. Data is an input your app sets, the line animates to new values, and hover or tap returns the point under the finger.
Line charts show change over time. The motion here draws the line in or moves it to new data, then stays still so it can be read.
We make ExodeUI. Every component on this page comes from our own library.
Try them live 10
Every component below is running. Drag, tap or type to try it, then open it in ExodeUI or see its inputs and code.
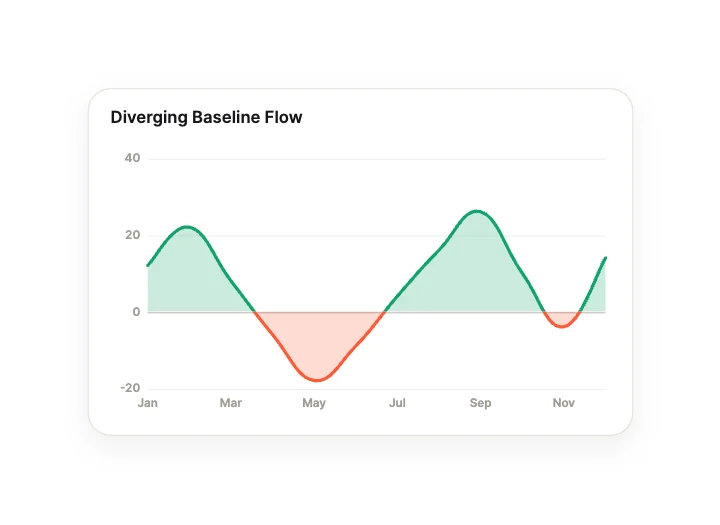
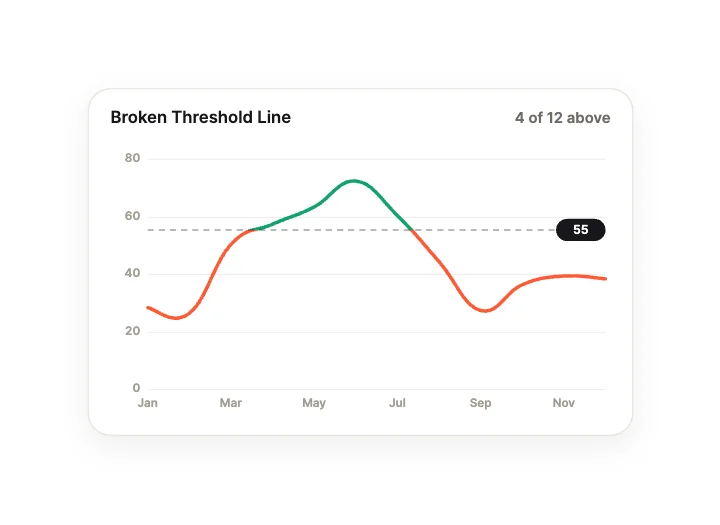
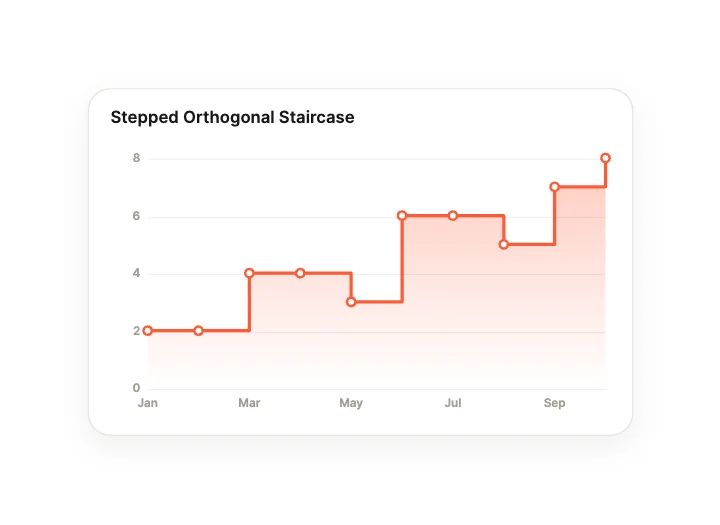
Stepped Orthogonal StaircaseCurves, Lines & Areas
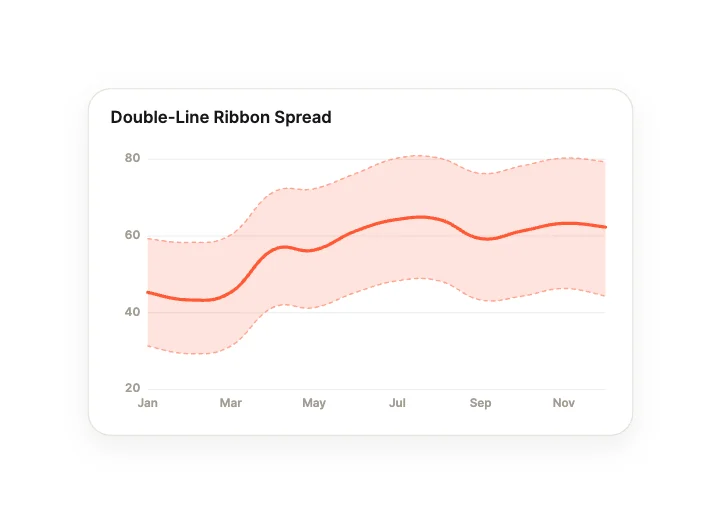
Double-Line Ribbon SpreadCurves, Lines & Areas
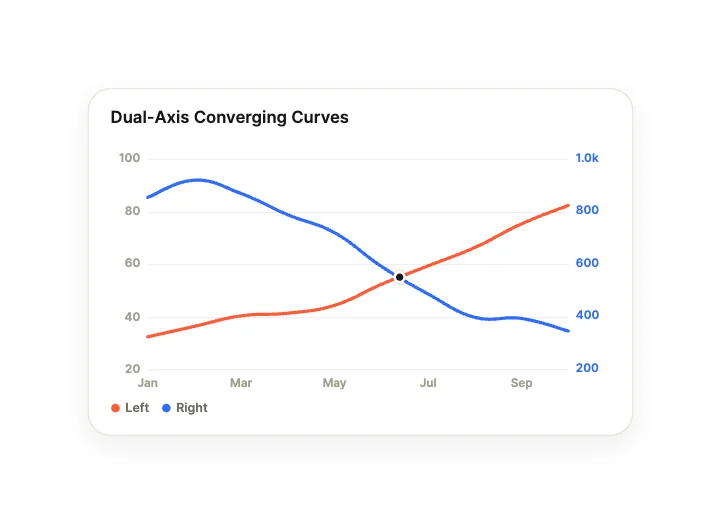
Dual-Axis Converging CurvesCurves, Lines & Areas
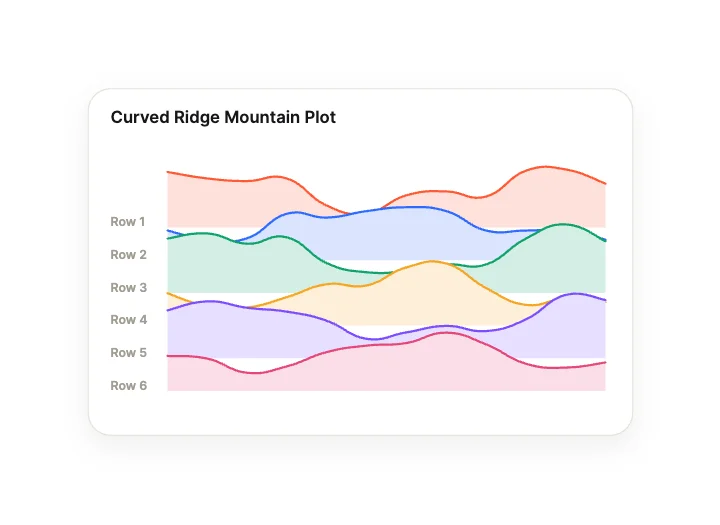
Curved Ridge Mountain PlotCurves, Lines & Areas
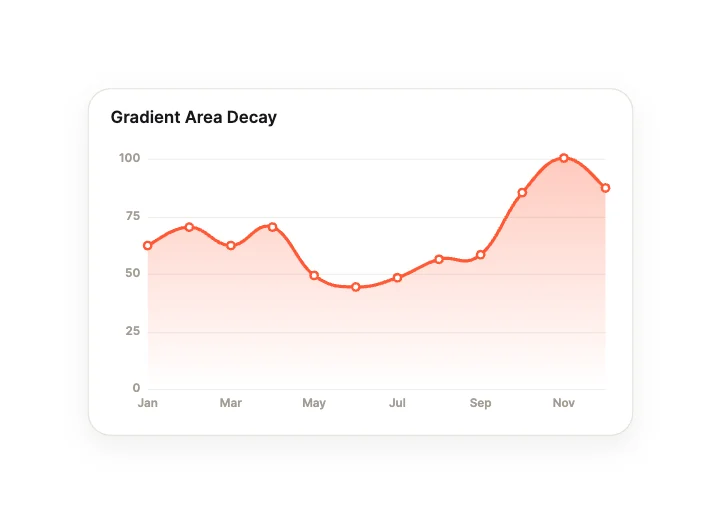
Gradient Area DecayCurves, Lines & Areas
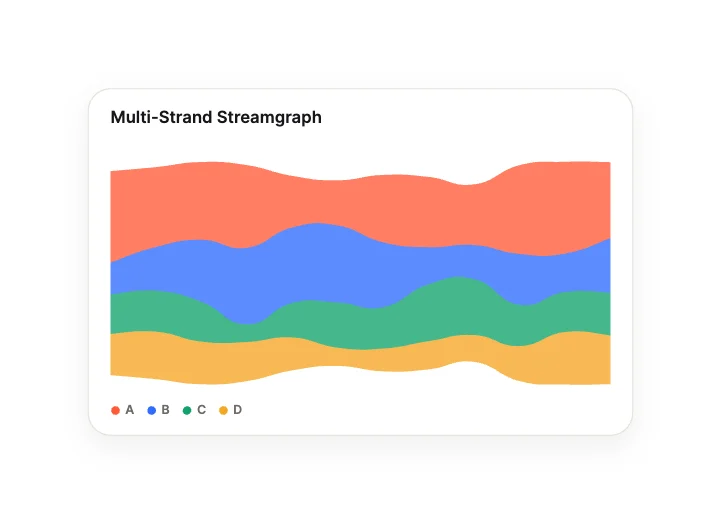
Multi-Strand StreamgraphCurves, Lines & Areas
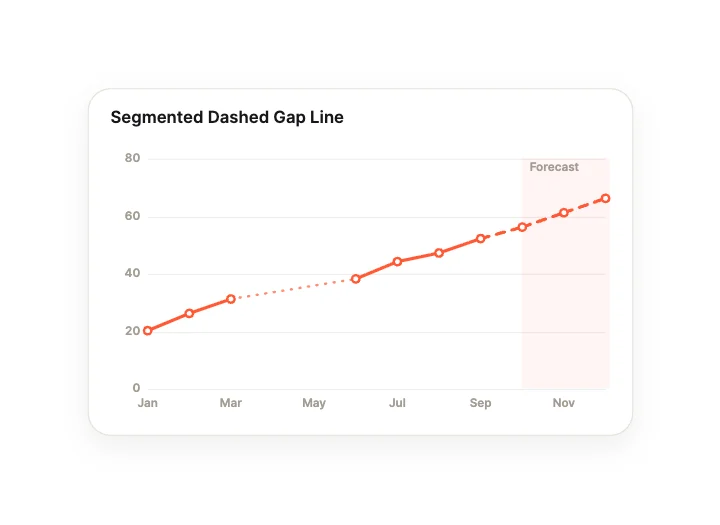
Segmented Dashed Gap LineCurves, Lines & Areas
What to look for in a line chart
- Labels that stay readable at small sizes.
- A clear difference between actual and forecast.
- Hover that shows the exact value.
- Motion only when the data changes.
Use it in your app
The code for Harmonic Bezier Spline, with its real file and input names. Every component on this page works the same way.
npm install exodeuiimport { useEffect } from 'react';
import { ExodeUICanvas, useExodeUI } from 'exodeui';
export function BezierSpline() {
const { engine, setEngine, updateInput, fireTrigger } = useExodeUI();
useEffect(() => {
updateInput("Harmonic Bezier Spline · Selected item", -1);
}, [engine]);
return (
<>
<ExodeUICanvas src="/bezier-spline.bexode" onReady={setEngine} />
<button onClick={() => fireTrigger("Harmonic Bezier Spline · Replay")}>Replay</button>
</>
);
}Questions
Is this line chart free?
Yes. Every design comes from a studio built into the ExodeUI editor, and the studios are part of the free Community plan. You can open and change any design without a paid plan, or download its .exode file from its page. The runtimes are free npm, Swift and Flutter packages.
How do I pass my data?
Set the chart’s data input from your app. New data animates in.
Can I read the hovered point?
Yes. The hovered and selected point come back as inputs your code reads.
Which frameworks does it work in?
Each design is one .exode file. The ExodeUI runtimes play the same file in React, Vue, Svelte, Angular, Solid, React Native, SwiftUI and Flutter, and the inputs have the same names in all of them.
Should I use a chart library instead?
For dashboards with many charts and complex axes, a charting library is often the better choice. These suit a few designed charts with motion.
Related
More free components
- Animated UI components
- Interactive UI components
- Animated elements for websites
- Animated React components
- Micro-interactions
- Animated form components
- Dark mode toggle
- Star rating
- Segmented control
- Range slider
- Knobs and dials
- Floating label input
- OTP input
- Password input
- Search bar
- Image carousel
- Donut chart
- Pricing table
- Liquid glass UI kit
Make your own in ExodeUI
Free to start. Every studio behind these components is built into the editor, and everything it makes stays native and editable.
Try ExodeUI for free