Measuring UX ROI: Connecting Design Work to Business Results
A practical way to estimate the return on UX work: benchmark a UX metric, choose a business KPI, convert the change, and report it responsibly with assumptions.
Core Takeaway
To estimate UX ROI, measure a UX metric before and after a change (for example task success or time on task), pick the business KPI it affects (conversion, support cost, retention), convert the UX improvement into a KPI change, and compare that value with the cost of the work. Report it as an estimate with its assumptions, not as a precise number.
The four steps
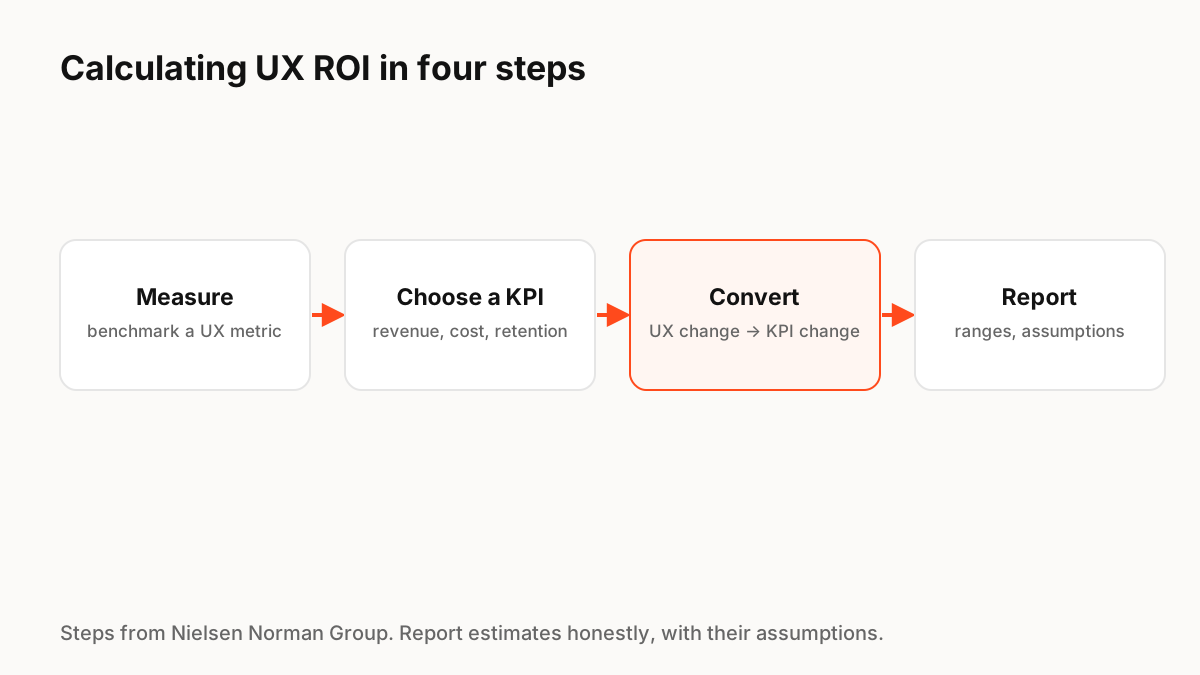
Nielsen Norman Group describes calculating ROI for design projects in four steps:
- Collect a UX metric in a benchmarking study, before and after the change.
- Choose a KPI the business already cares about.
- Convert the change in the UX metric into a change in the KPI.
- Report responsibly, with the assumptions and uncertainty.
Pick metrics that connect
Good pairs are direct: checkout task success and conversion rate; findability of help content and support tickets; onboarding completion and activation or retention. Avoid vanity metrics, such as page views or time on site, that can rise for bad reasons.
An example calculation
Suppose a redesign raises checkout task success in testing from 70% to 80%. If 10,000 people a month start checkout and the average order is $50, and you assume real-world completion moves by a similar proportion, that is roughly 1,000 extra orders a month, about $50,000 in monthly revenue, before comparing it with the cost of the work. State every assumption; the point is a defensible range, not false precision.
Design systems and debt
For design systems and UX debt cleanup, ROI often shows up as time saved: hours not spent rebuilding components, fewer UI bugs, faster feature delivery. Track build time for comparable features before and after, and bugs per release in affected areas.
Key Principles to Remember
- Benchmark a UX metric before and after
- Connect it to a KPI leadership already tracks
- Convert the change, compare with the cost
- Report ranges and assumptions, not false precision
- For systems work, measure time saved and bugs avoided
Frequently Asked Questions
Sources
- Calculating ROI for Design Projects in 4 Steps — Nielsen Norman Group
- The 6 Levels of UX Maturity — Nielsen Norman Group